
As we work toward our goal of becoming the most diverse, equitable and inclusive academic medical system in the country, we hold ourselves accountable for our progress by looking at data and metrics. Success will only come as we continue to prioritize this work, implement multiple interventions, and review the data. In addition to the information below, robust DEI Statistics are available on the Office of Diversity and Outreach's website and Office of Faculty and Academic Affairs website.
Leadership
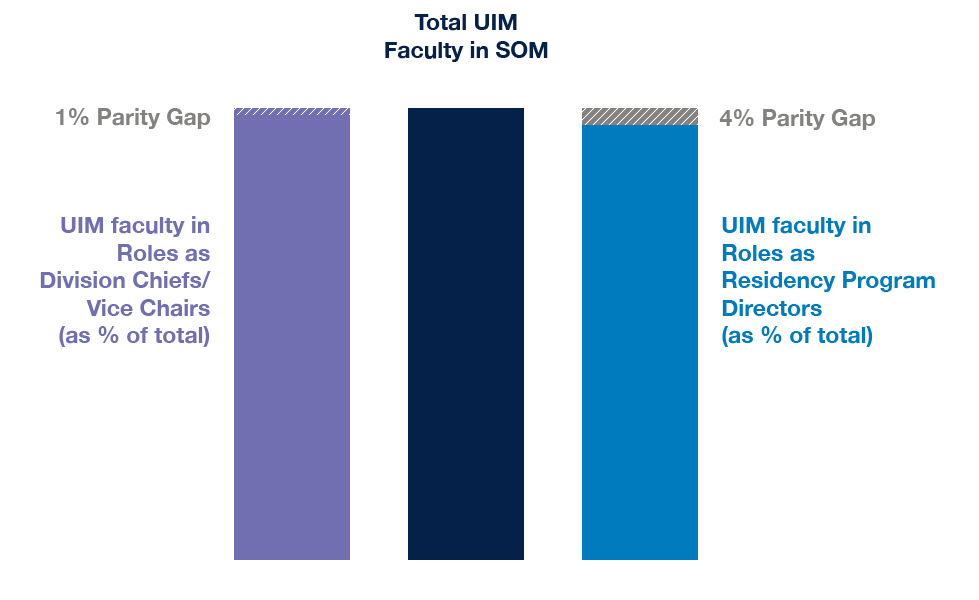
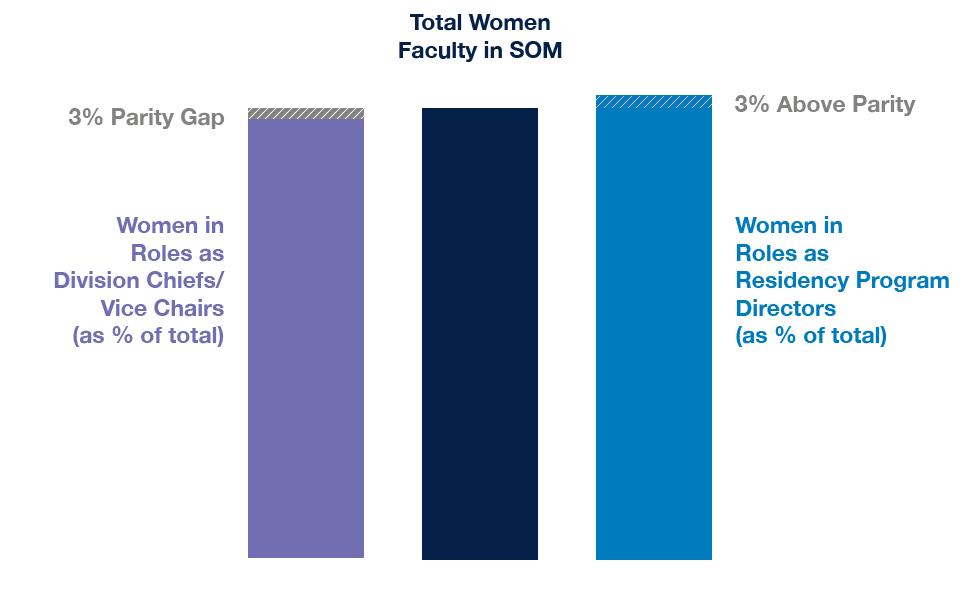
Women hold just over 45% of leadership positions* overall in the SOM, and UIM hold 14%. In the last seven years, over half of our department chairs turned over and 44%** of those leadership roles were filled by women or UIM appointees.
67%
UIM or Female appointees on Deans Council
44%
UIM or Female New Chair Appointments From 2017 to 2024
32%
UIM or Female Department Chairs***
*Dean, Vice Deans, Associate Deans, Department Chairs, ORU Directors, Vice Chairs and Division Chiefs.
**Of the new chair appointments, 38% are female and 33% UIM.
***Of the UIM or female department chairs, 28% of our department chairs are female and 14% are UIM.
We are working towards diversifying our leadership to mirror the diversity of our faculty.
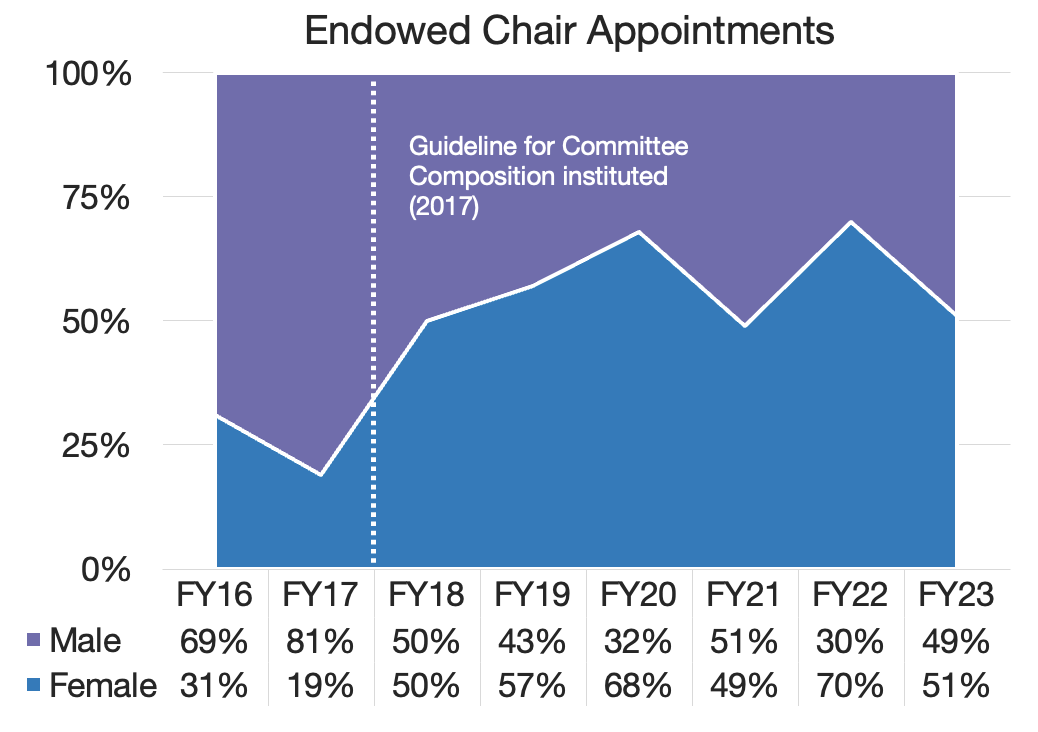
In 2017, we instituted a Guideline for Committee Composition: “All committees appointed by the Dean’s Office, departments, divisions, ORU’s, and centers, should be comprised of 50% women or those underrepresented in medicine.”
An example of how this has changed our demographics is demonstrated through our Endowed Chair Appointments:
Recruitment, Retention, and Climate
One method we use to benchmark our progress towards recruitment and retention of diverse faculty is through comparison to national data published by the AAMC Faculty Roster. Despite the fact that there remains persistent underrepresentation of certain racial and ethnic minority groups and women in medical school faculty positions nationwide, our individual departments are working to rise above their national counterparts.
| (based on AAMC national benchmark data) | 2016 | 2023 |
|---|---|---|
| Clinical departments that met or exceeded expected percent of URM faculty | 50% | 100% |
| Basic science departments that met or exceeded expected percent of URM faculty | 40% | 40% |
| Clinical departments that met or exceeded expected percent of female faculty | 69% | 94% |
| Basic science departments that met or exceeded expected percent of female faculty | 20% | 20% |
Because there is no AAMC benchmark data, the following departments are not represented in this data: Laboratory Medicine, Neurological Surgery, Radiation Oncology and Urology
80% of our faculty have completed the Diversity, Equity, and Inclusion (DEI) Champion Training, which includes education on implicit biases and microaggressions, coaching in skills related to addressing these issues, and training in how to apply thoughtful, active listening and empathy to support a more diverse, equitable, and inclusive environment.
80%
OF OUR SOM FACULTY HAVE COMPLETED THE TRAINING
2,429
TOTAL NUMBER OF FACULTY WHO HAVE COMPLETED THE TRAINING
1,756
TOTAL NUMBER OF STAFF AND TRAINEES WHO HAVE COMPLETED THE TRAINING
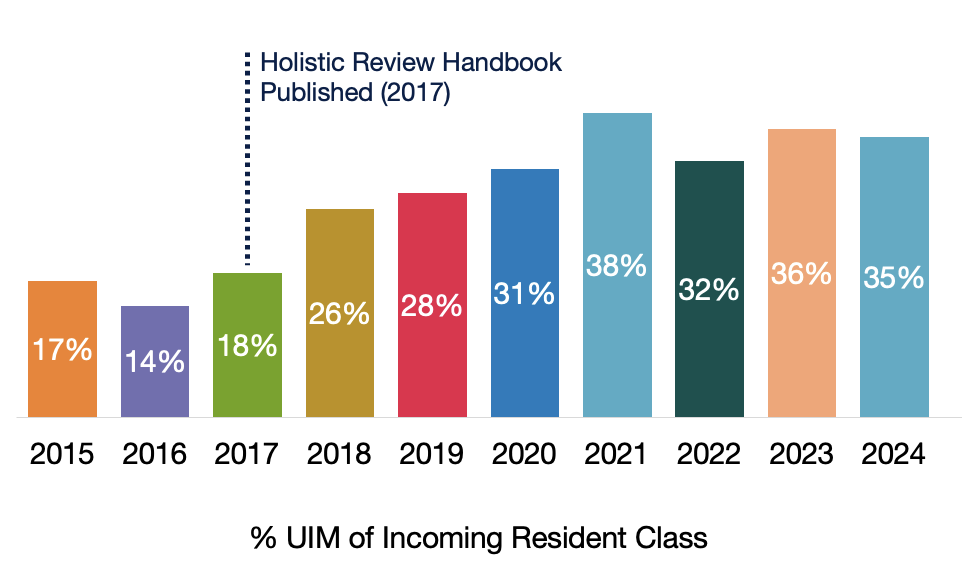
Through our Holistic Review and Best Practices for Diversifying GME Handbook, our Visiting Elective Scholar Program, and our GME Diversity Second Look program, we have increased the number of UIM residents from 17% to 35%.
To increase the number of UIM and female basic scientists at UCSF, the Interdepartmental Basic Science Search process was created to pool resources and attract top talent. Since its inception in 2019, 69% of faculty hired to our basic science departments have been UIM or women.
69%
of faculty hired in our basic science departments
From 2019 to 2024 are UiM or women
Student Admissions
Since 2019, the percentage of UIM students has grown from 33% to 46% and the percentage of students who are first generation to college has increased from 13% to 22%.
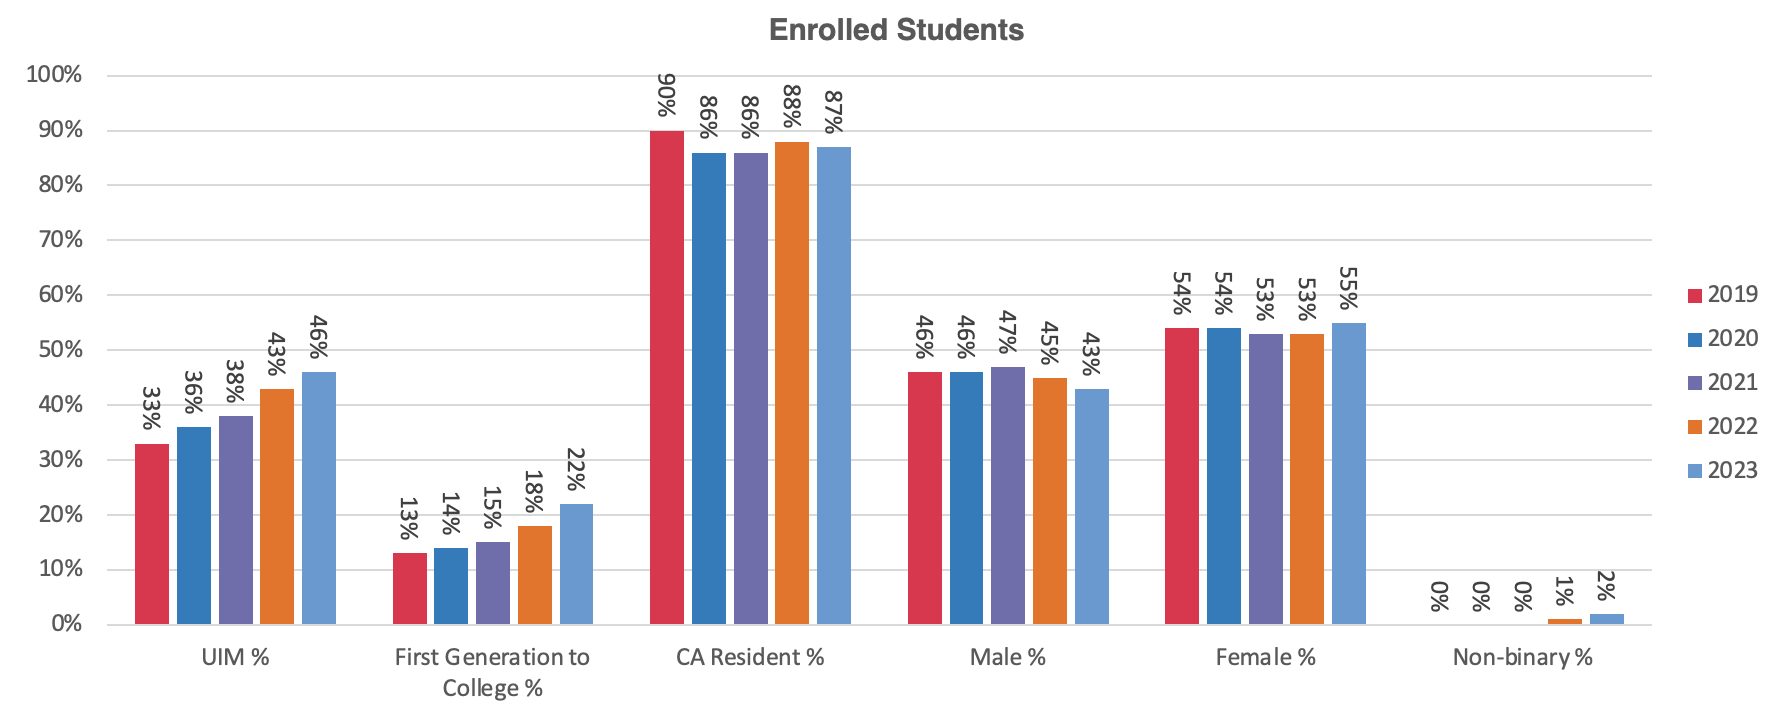
UIM is defined as identifying with at least one of the following races/ethnicities: Hispanic/Latinx, Black/African American, Pacific Islander/Native Hawaiian (including Filipinx), Native Indian/Alaska Native.
To address the changing competitive landscape for top student talent, the School of Medicine's $100MM Scholarship Initiative had a direct, positive impact on recruitment.
Research
In three years, we increased the number of NIH Diversity Supplements at UCSF and brought in $3.6 million in funding for URM trainees in 2024.
300%
increase in NIH DIVERSITY SUPPLEMENTS OVER 3 YEARS
$3.6MM
BROUGHT IN FOR URM TRAINEES in 2024